Performance Marketing Budget Allocation & Bid Strategy at Scale: From Channel Silos to Cross-Channel ROI
Mid-level performance marketers (2–5 years) who manage individual channels (Google Ads or Meta) and are stepping into multi-channel budget ownership for the first time. Candidates targeting Performance Marketing Specialist roles at high-volume B2C platforms (e-commerce, travel, fintech).
- Allocate a ₹1Cr+/month multi-channel budget across Google Search, Meta, and Bing using marginal ROAS as the primary decision framework
- Build and follow daily/weekly/monthly budget pacing and reallocation cadences without disrupting campaign learning phases
- Select the right automated bidding strategy (tCPA, tROAS, Max Conversions) for each campaign type and know when manual bidding still wins
- Evaluate cross-channel attribution models, identify where each platform overcounts, and build a de-duplicated ROI view
- Run a basic incrementality check (geo holdout or conversion lift) and use the result to defend a budget reallocation to stakeholders
The Cross-Channel Budget Mental Model — Marginal ROAS and Diminishing Returns
Most performance marketers spend their careers optimising a single channel. You get good at Google Search. Or you learn Meta cold audiences. That expertise is real and valuable. But the moment you own a budget across multiple channels, the game changes completely.
Single-channel optimisation asks: "How do I get the best ROAS from this channel?" Cross-channel portfolio management asks a harder question: "Where does the next rupee produce the most return?" Those two questions have different answers, and confusing them is how teams waste 20–30% of large-scale budgets every month.
This chapter builds the mental model you need to answer the second question consistently.
Prerequisites check
Before starting, confirm you can:
- Define CPA, ROAS, and conversion rate in your own words.
- Log in to Google Ads and navigate to campaign-level reporting.
- Read a basic performance table: impressions, clicks, conversions, spend, revenue.
If conversion tracking is unfamiliar territory — you don't know how a Google conversion action or Meta Pixel event is set up — pause and review your platform's conversion setup guide first. Budget decisions are only as reliable as the conversion data underneath them.
The problem with single-channel ROAS
Imagine you run three campaign groups: Google Search (branded), Google Search (non-branded), and Meta Prospecting. You review last month's numbers:
| Channel | Spend (₹) | Revenue (₹) | ROAS |
|---|---|---|---|
| Google Search — Branded | 4,00,000 | 24,00,000 | 6.0x |
| Google Search — Non-Branded | 10,00,000 | 30,00,000 | 3.0x |
| Meta Prospecting | 6,00,000 | 12,00,000 | 2.0x |
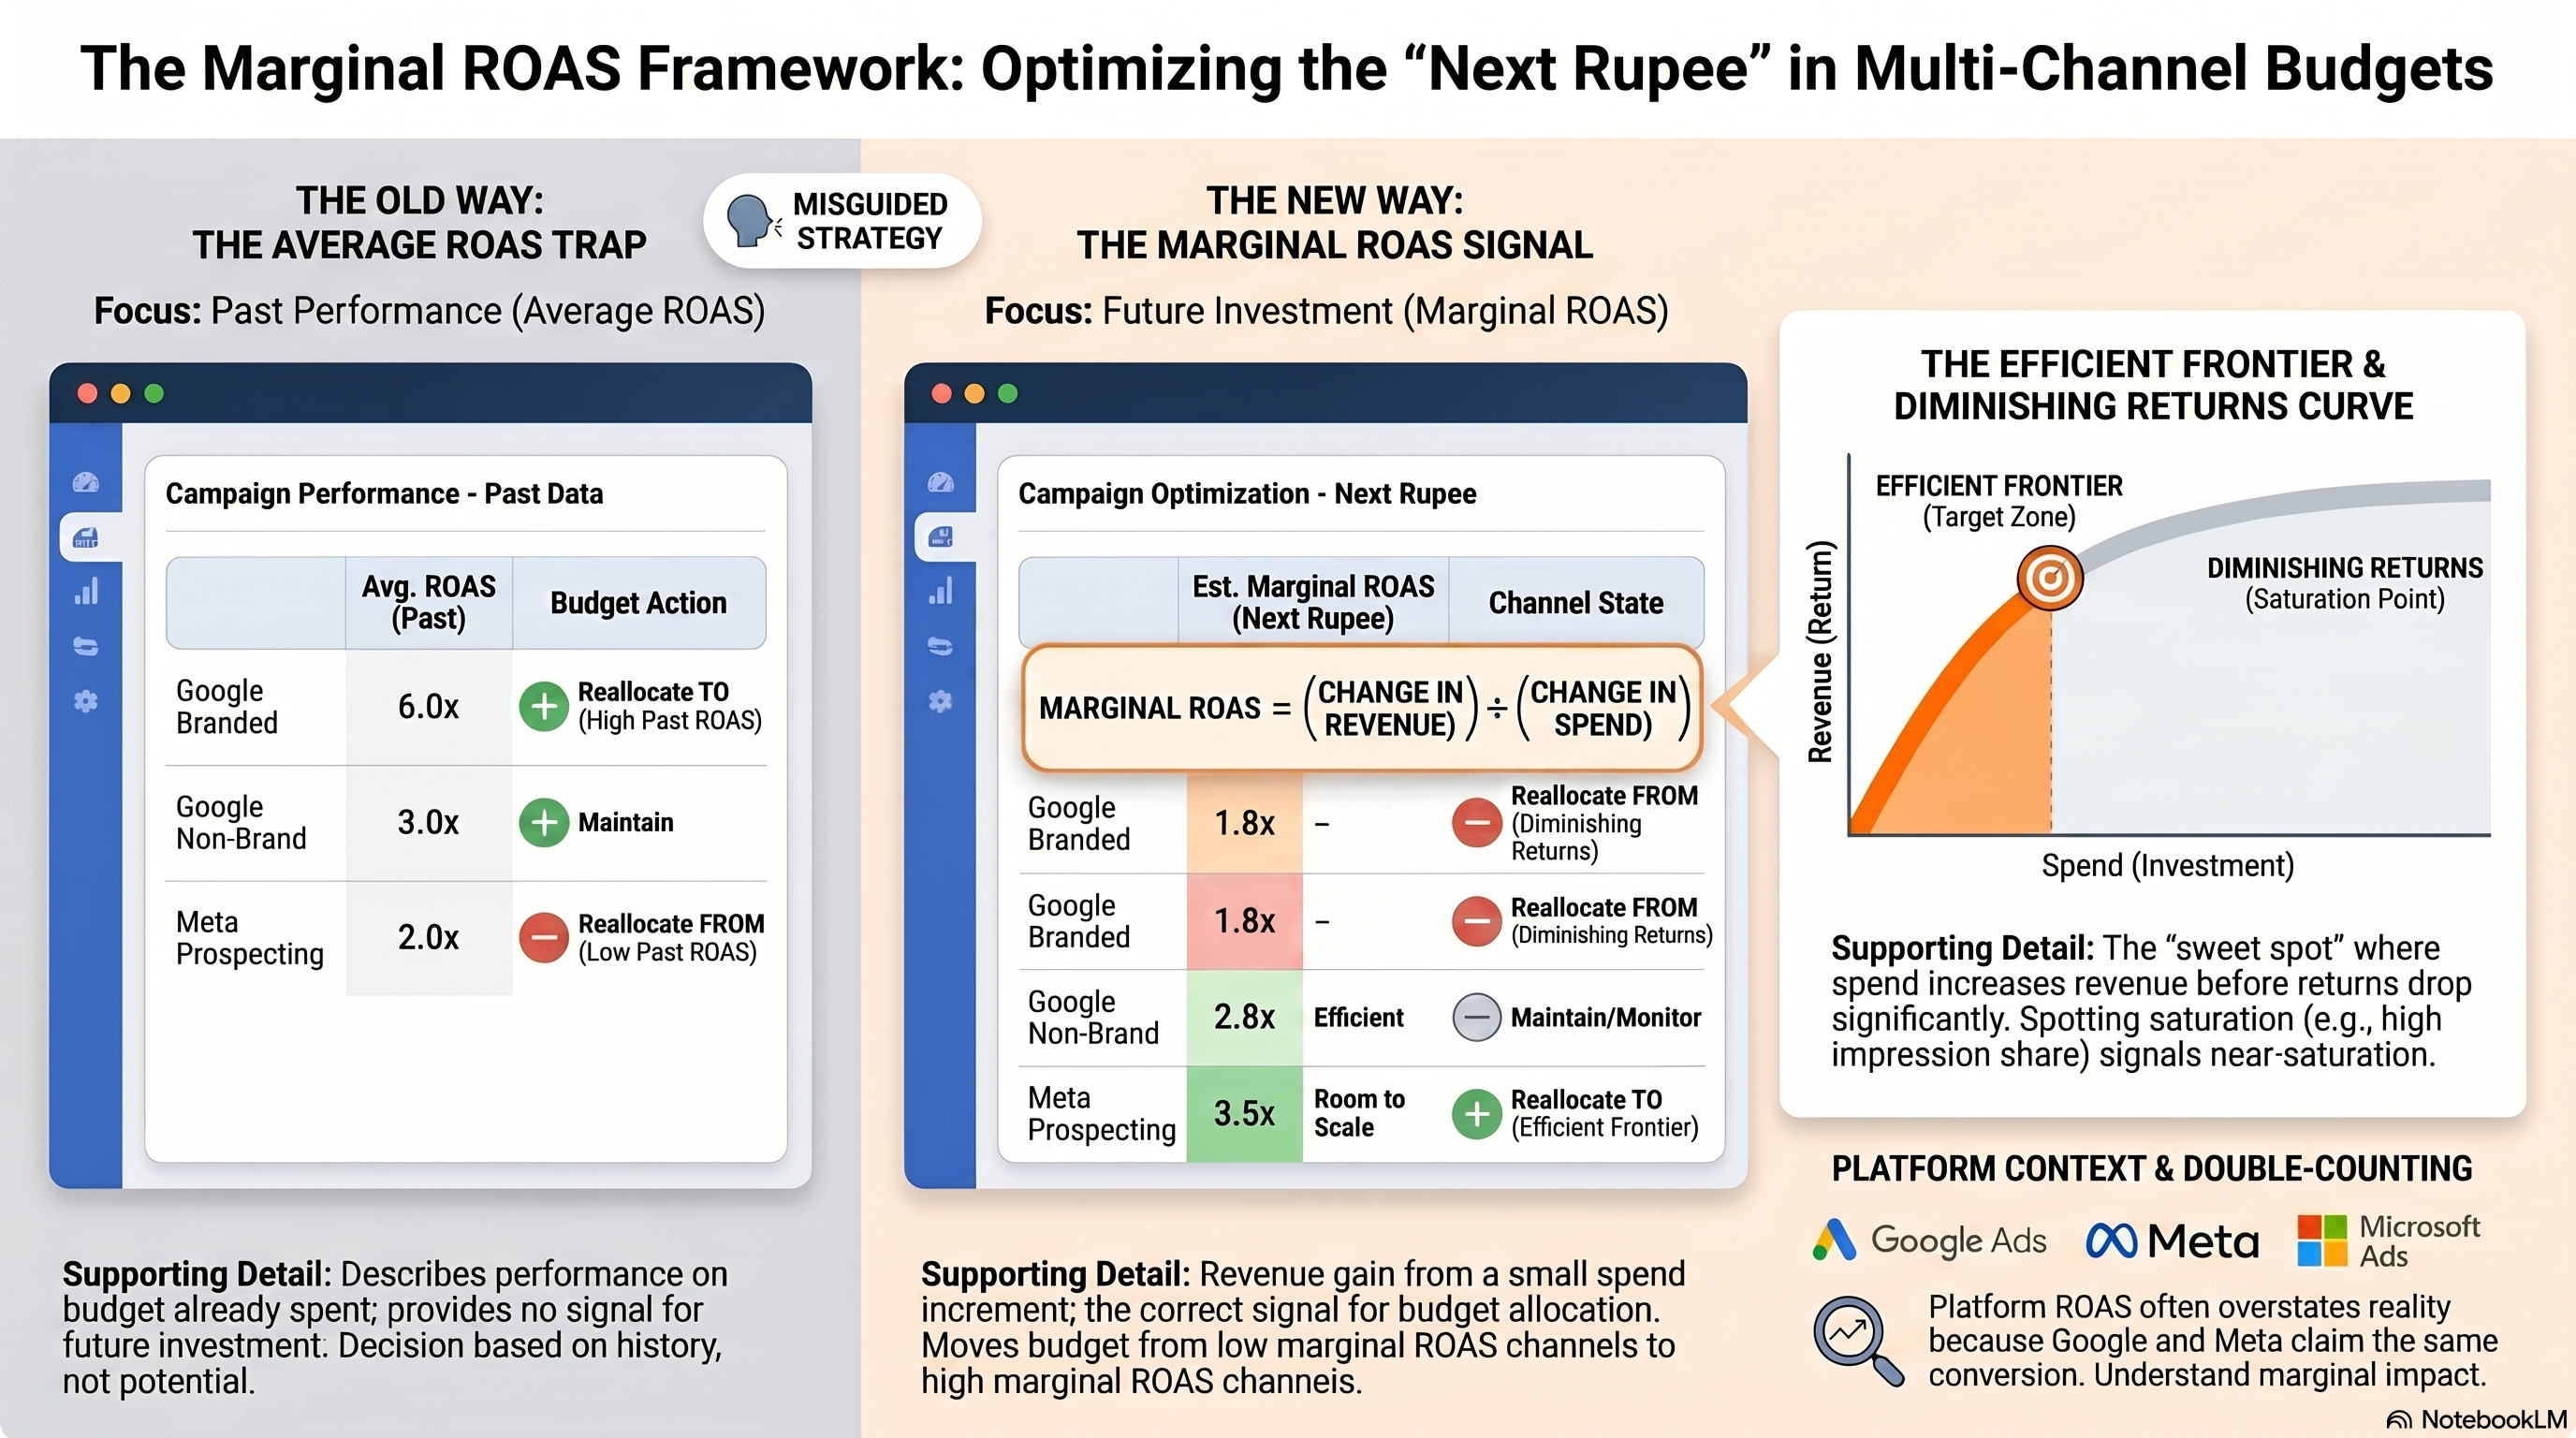
A naive optimiser looks at this table and concludes: shift budget to Branded (6x ROAS!) and cut Meta (only 2x). This is the most common mistake in multi-channel budget management — and it misses two critical facts.
Fact 1: Branded search is bounded. Branded search captures people already searching for your company. You cannot scale it arbitrarily — the demand is fixed by how many people know your brand. Doubling branded search spend does not double branded searches. At some point, every additional rupee returns less than the last.
Fact 2: ROAS is an average, not a signal of where to invest next. The 6x ROAS on branded search describes performance on the budget you've already spent. It says nothing about what happens if you spend ₹1 more.
The right question is: "What does the next rupee earn?" That's marginal ROAS.
Marginal ROAS: the correct allocation signal
Marginal ROAS = (change in revenue) ÷ (change in spend) for a small increment of additional budget.
In practice, you estimate it from the diminishing returns curve of each channel. But the intuition is simple: if Google Search already captures 95% of relevant demand at current spend, adding ₹1L more will earn very little in incremental revenue — marginal ROAS is low. If Meta Prospecting still has a large untapped audience, adding ₹1L there may produce ₹2.5–3L in attributable revenue — marginal ROAS is higher.
The allocation rule: move budget from the channel with the lower marginal ROAS to the channel with the higher marginal ROAS until they equalise.
This is the same logic as any portfolio optimisation. You're maximising the return on each marginal rupee spent, not the average return across all rupees already committed.
A worked example
Continuing the table above, suppose you have data suggesting the following marginal ROAS estimates at current spend levels:
| Channel | Current Spend | Avg ROAS | Est. Marginal ROAS |
|---|---|---|---|
| Google Branded | ₹4L | 6.0x | 1.8x (near-saturated) |
| Google Non-Branded | ₹10L | 3.0x | 2.8x |
| Meta Prospecting | ₹6L | 2.0x | 3.5x (room to scale) |
Even though Meta Prospecting has the worst average ROAS, it has the best marginal ROAS — each additional rupee there earns more than an additional rupee on any other channel. The correct move is to reallocate from branded search (marginal ROAS 1.8x) toward Meta Prospecting (marginal ROAS 3.5x).
Diminishing returns curves: the underlying mechanic
Every marketing channel follows a diminishing returns curve. The first rupee you spend on a channel reaches the most valuable, easiest-to-reach audience. The second rupee reaches slightly less valuable audience. Eventually, you're spending on audiences so marginal that the return barely justifies the cost.
Visualise it as a curve: X-axis is spend, Y-axis is revenue. Early spend is steep (high return per rupee). The curve flattens as you approach saturation.
The efficient frontier is the spend range where the curve is still meaningfully steep — where each additional rupee returns more than a defined floor (typically 2–3x for B2C). Beyond the efficient frontier, you're in diminishing returns territory: you can still spend more, but the incremental return per rupee is falling fast.
For practical budget decisions, you need a rough sense of where each channel sits on its curve:
- Below efficient frontier: under-investing. Marginal ROAS is high. Increase spend.
- In the efficient frontier zone: well-calibrated. Monitor marginal ROAS for changes.
- Above efficient frontier: near-saturated. Marginal ROAS is declining. Reallocate.
You estimate this from historical data: run the channel at different spend levels over several weeks (or use dayparting to observe weekend/weekday variation in efficiency) and observe how ROAS changes as spend increases. A steep drop in ROAS as spend rises is the classic saturation signal.
<Callout type="warning"> Don't confuse creative fatigue with saturation. If a campaign's ROAS drops sharply after 3 weeks of consistent spend, the cause may be audience exhaustion at the ad-set level (the same people have seen your ad too many times), not true channel saturation. Refresh creatives or expand audiences before concluding the channel is saturated. </Callout>
Budget hierarchy: how controls are structured
Before you can allocate budget, you need to understand how budget controls are structured on each platform.
Google Ads hierarchy
Account (no budget control)
  └── Campaign (budget set here — daily budget)
        └── Ad Group (no budget control)
              └── Ad (no budget control)
Google budgets are set at the campaign level as a daily budget. Google may spend up to 2x the daily budget on high-demand days, but will not exceed the monthly equivalent (daily budget × 30.4) over the course of a month. For multi-campaign management, use shared budgets to pool a single budget across multiple campaigns and let Google allocate automatically.
Meta (Facebook/Instagram) hierarchy
Ad Account (has account-level spending limit — optional)
  └── Campaign (Campaign Budget Optimisation — optional)
        └── Ad Set (budget set here by default — daily or lifetime)
              └── Ad (no budget control)
Meta offers two budget models. With Ad Set Budget Optimisation (ABO), you set budgets per ad set — full manual control, but no automatic reallocation. With Campaign Budget Optimisation (CBO, now Advantage+ Budget), you set a campaign-level budget and Meta's delivery system allocates it across ad sets in real time based on performance signals. For large accounts, CBO/Advantage+ Budget reduces manual pacing work but requires trusting Meta's allocation logic.
Microsoft Ads (Bing)
Microsoft Ads mirrors Google's structure: daily budgets at the campaign level with a monthly cap option. For most B2C advertisers, Bing spends are 10–20% of Google spend at comparable CPAs — useful for incremental reach but rarely the primary allocation decision.
Why ROAS benchmarks mislead without incrementality context
You've probably heard benchmarks like "a 3x ROAS is good for e-commerce" or "target a ₹200 CPA for travel." These benchmarks cause expensive mistakes at scale for one reason: they don't account for whether your spend is actually causing the conversions you're counting.
At ₹5L/month, your attribution error is small — most conversions you're counting were probably driven by your ads. At ₹1Cr/month, you're operating in markets where consumers are exposed to your ads multiple times across channels, and where organic brand demand creates many conversions that would have happened anyway.
Platforms make this worse. Google's default attribution model (data-driven, but trained on Google-observed data) will attribute credit to Google touchpoints. Meta's delivery system does the same. Both platforms count many of the same conversions. A campaign reporting 3x ROAS on Google and 2.5x ROAS on Meta may actually be sharing the same pool of conversions — the "true" incremental ROAS is much lower.
The practical implication: use ROAS benchmarks for directional sanity-checks only. To know whether spend is actually producing incremental conversions — above what would have happened without advertising — you need an incrementality test. Chapter 4 covers how to run one. For now, carry this rule: any ROAS number from a platform's own reporting overstates the true incremental ROAS.
Hands-on exercise
Given: A fictional account spending ₹50L/month with the data below. Apply marginal ROAS thinking to propose a reallocation.
| Channel | Monthly Spend (₹) | Reported Revenue (₹) | Avg ROAS | Notes |
|---|---|---|---|---|
| Google Search — Branded | 8,00,000 | 56,00,000 | 7.0x | Impression share: 98% |
| Google Search — Non-Brand | 18,00,000 | 63,00,000 | 3.5x | Impression share: 52% |
| Google Shopping | 10,00,000 | 28,00,000 | 2.8x | Impression share: 41% |
| Meta Prospecting | 8,00,000 | 16,00,000 | 2.0x | Frequency: 1.8 |
| Meta Retargeting | 6,00,000 | 22,80,000 | 3.8x | Audience: 90,000 users |
Your task:
- Identify which channels are likely near-saturated (high impression share or frequency) and which have room to scale.
- Use marginal ROAS reasoning to propose a revised monthly allocation across the same ₹50L total budget.
- For each reallocation decision, write one sentence explaining the marginal ROAS logic.
- Identify one caveat or unknown that would change your recommendation if the data showed it.
Success criteria: - Your revised allocation sums to ₹50L - Each channel's budget change has a clear marginal ROAS justification - You named at least one channel as near-saturated with supporting evidence from the data - You identified one attribution caveat (e.g., retargeting and branded search likely share the same pool of high-intent converters)
What's next
Chapter 2 moves from the allocation decision to the operational discipline of running a budget: how to pace spend across the month, what to check weekly, and how to reallocate mid-flight without destroying campaign learning phases.
[1]: Google Ads Help, "About daily budgets", https://support.google.com/google-ads/answer/2471188 [2]: Meta Business Help, "Campaign budget optimisation", https://www.facebook.com/business/help/214319818801882
References
Budget Pacing, Reallocation Cadences, and Mid-Flight Decisions
You have the allocation right. Now you need to execute it across a calendar month without overspending, underspending, or disrupting the learning phases of your automated bidding strategies. That's budget pacing.
Most marketers underestimate pacing complexity. The platforms don't spend budgets linearly. A campaign with a ₹10,000 daily budget might spend ₹18,000 on a high-demand Tuesday and ₹7,000 on a slow Sunday. Over a full month this usually averages out — but in any given week, you can be significantly ahead or behind your targets without realising it.
This chapter gives you the operational discipline to catch and correct pacing deviations before they become end-of-month problems.
Prerequisites check
Before starting, confirm you can:
- Find campaign-level daily spend in Google Ads (Campaigns table → Columns → Conversions)
- Find ad set-level daily spend in Meta Ads Manager (Ads Manager → Columns → Performance)
- Export a date-range spend report from at least one platform
The daily pacing formula
The foundational calculation in budget pacing is your daily spend target:
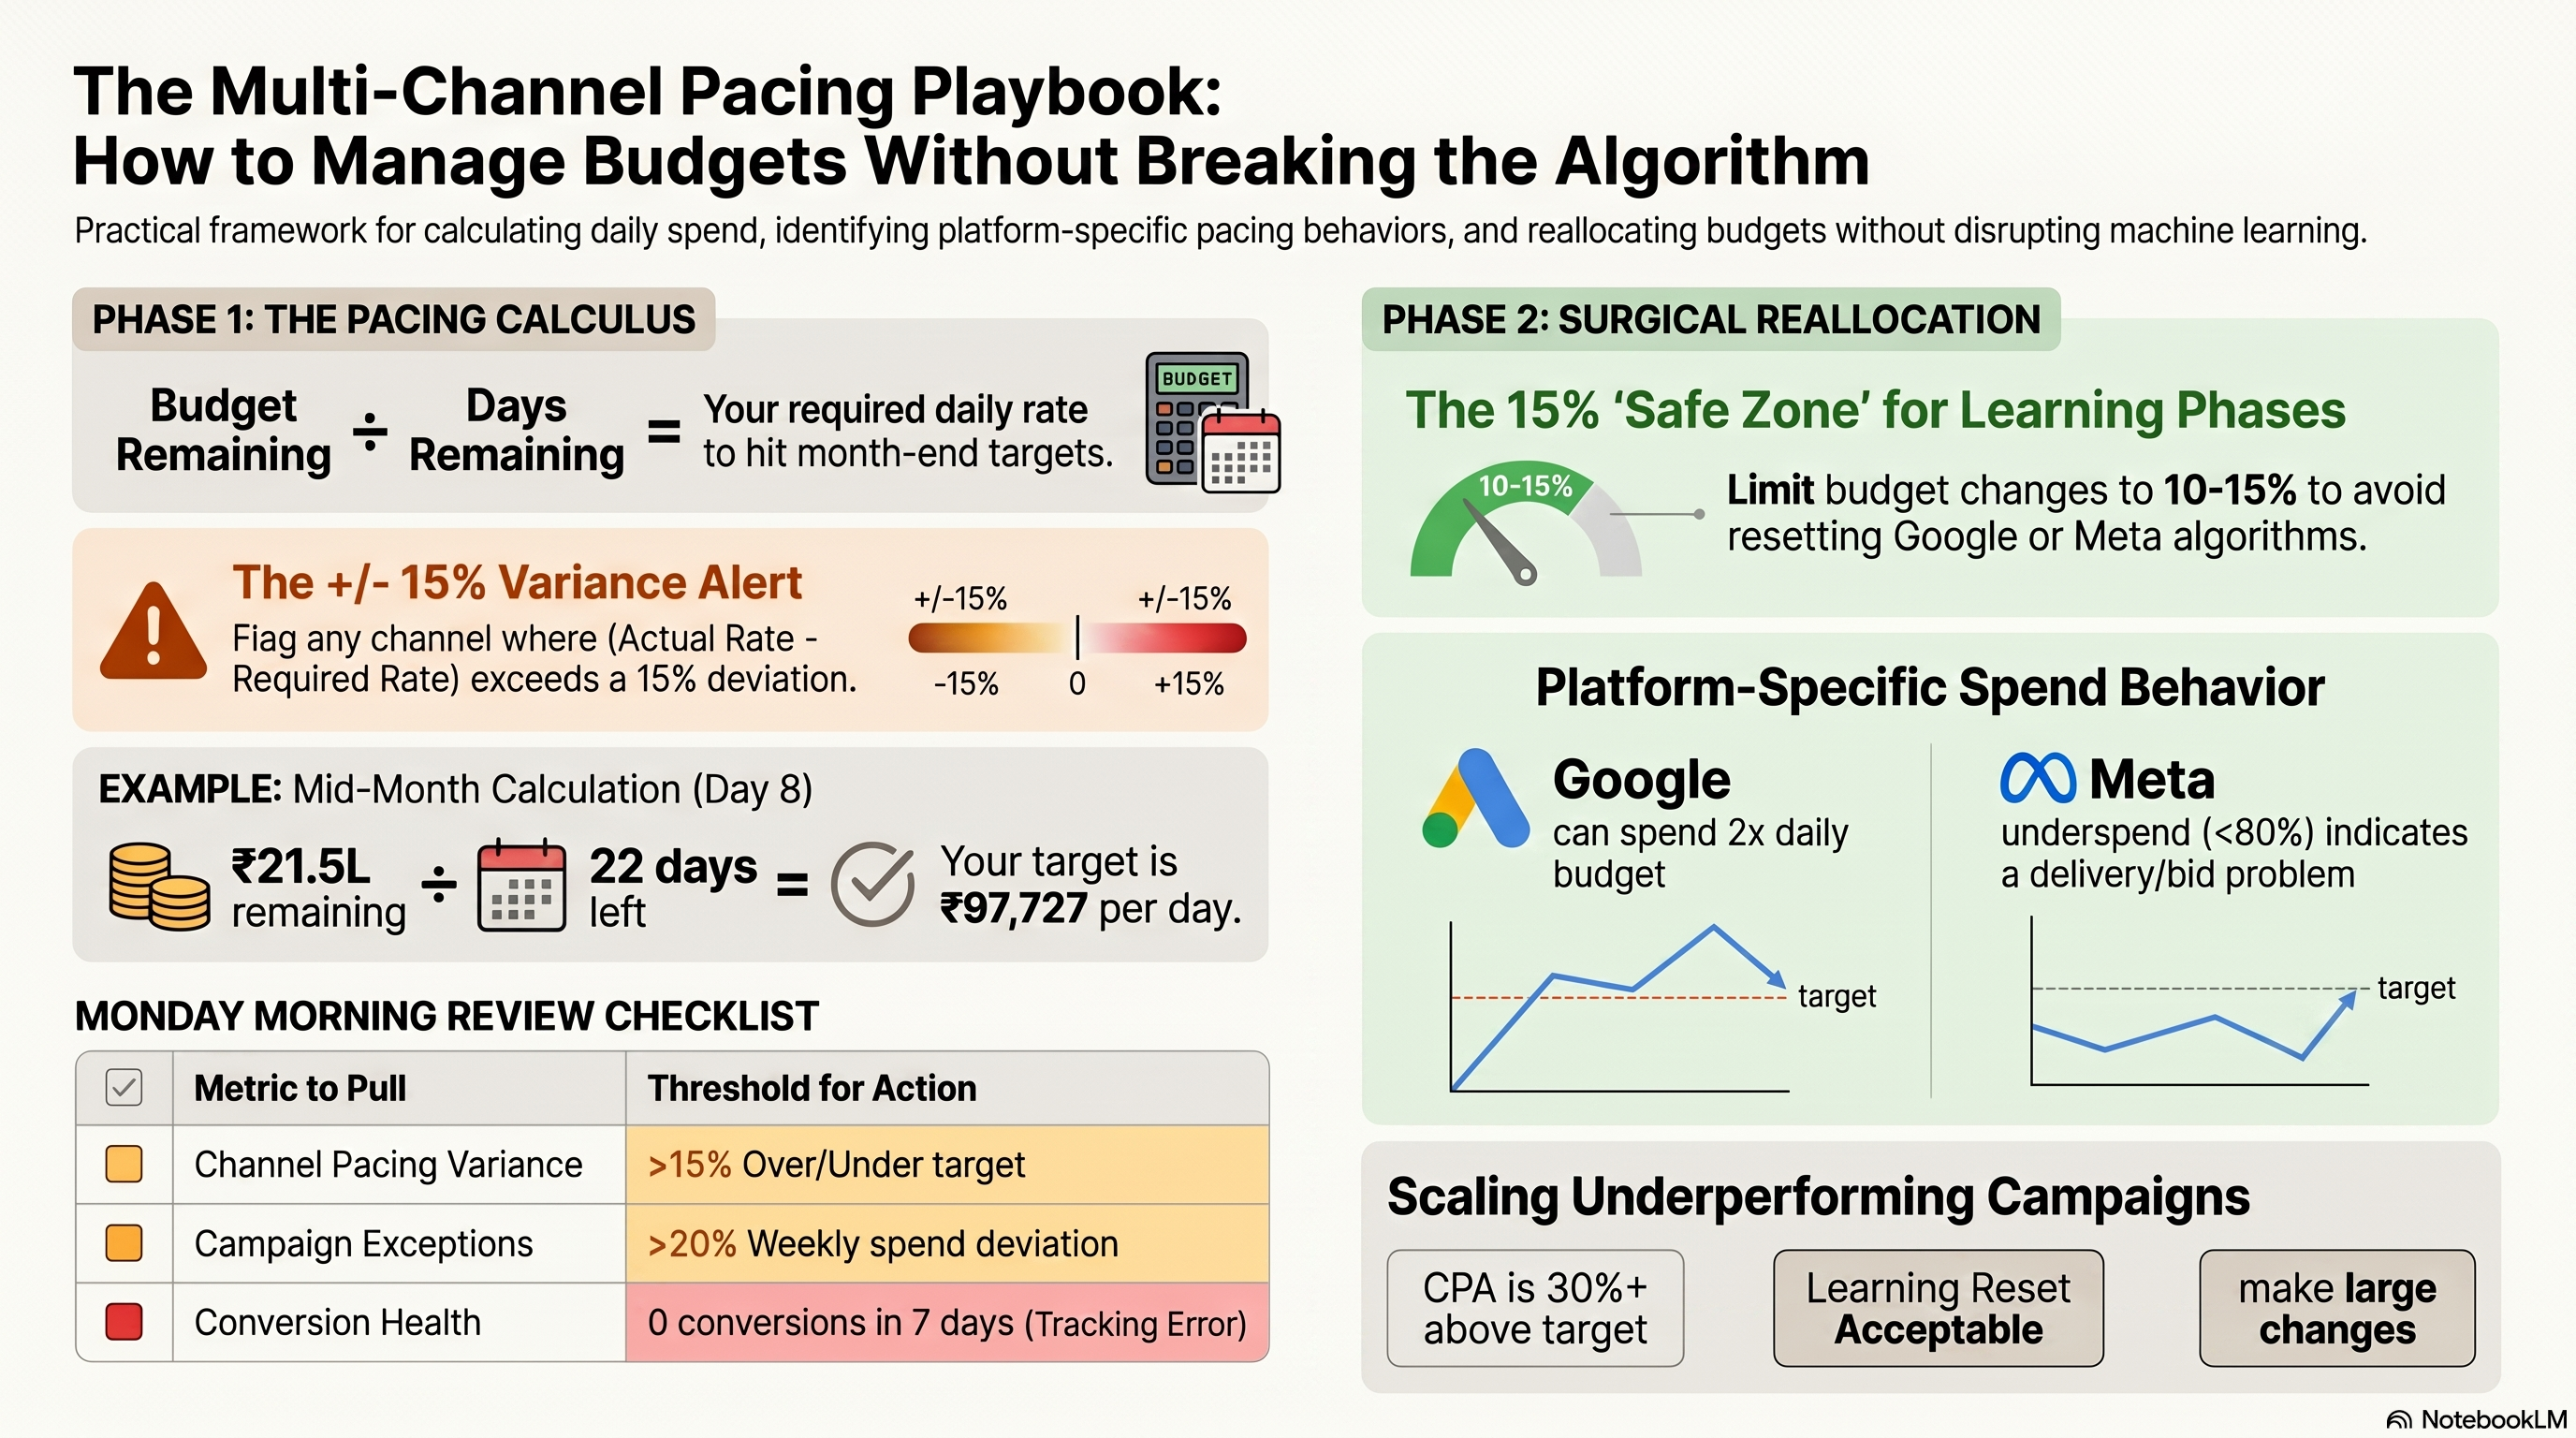
Daily spend target = Monthly budget ÷ Business days remaining (or calendar days, depending on your model)
Most B2C performance campaigns run seven days a week, so use calendar days. For B2B campaigns with strong weekday skew, use business days.
Example: You have a ₹30L monthly budget starting June 1. On June 8 (8 days in), you check performance.
- Calendar days remaining: 22 (June 9–30)
- Spend to date: ₹8,50,000
- Budget remaining: ₹30,00,000 − ₹8,50,000 = ₹21,50,000
- Required daily rate for the rest of the month: ₹21,50,000 ÷ 22 = ₹97,727/day
Compare that to your actual daily spend over the past 7 days. If you're running at ₹1,05,000/day, you're on track to overspend. If you're running at ₹85,000/day, you're pacing to underspend.
The pacing variance formula:
Pacing variance (%) = (Actual daily rate − Required daily rate) ÷ Required daily rate × 100
A +15% variance means you're spending 15% faster than needed and will overspend unless you intervene. A −15% variance means you'll underspend and leave budget on the table.
How Google's 2x daily allowance works
Google Ads can spend up to 2× your daily budget on days when search demand is high. It compensates by spending less on lower-demand days. The guarantee is that your total monthly spend will not exceed (daily budget × 30.4).
This behaviour has two important implications:
Implication 1: Your spend will not be flat day-over-day. A daily budget of ₹10,000 might produce daily spends ranging from ₹6,000 to ₹20,000. This is normal and expected. Don't intervene every time a single day spikes.
Implication 2: Month-end is the risk point. If your campaign has been consistently hitting 1.5–2x the daily budget, Google has been accumulating a "spend debt" that must be balanced. You may see dramatically lower spend in the final days of the month as Google brings the monthly total back under the cap.
What to watch for: If you're in the final 5 business days of the month and daily spend has dropped sharply (>30% below your target rate) without any campaign changes, you're likely seeing Google's monthly cap enforcement. There's nothing to "fix" — this is normal. But it means you should not set a ₹10,000 daily budget and expect ₹10,000 every day.
How Meta's delivery system paces
Meta's delivery system is fundamentally different from Google's. Meta runs a real-time auction where your ad set competes for every impression. Your budget sets a maximum expenditure, but Meta doesn't guarantee you'll reach it — it depends on your bid, audience, and creative quality.
Key pacing behaviors to understand:
Front-loaded delivery: New ad sets often spend aggressively in the first 2–3 days of the learning phase as Meta's system collects initial data. This can create the illusion of overspending early in the month. After the learning phase stabilises (~50 conversions in 7 days for optimal performance), delivery typically evens out.
Lifetime vs. daily budgets: Ad sets can use either a daily budget (Meta tries to spend that amount each day) or a lifetime budget with an end date (Meta paces across the full campaign period). For always-on campaigns, daily budgets are simpler to manage. For promotions with fixed end dates (Diwali sale, product launch), lifetime budgets give Meta more flexibility to find the best delivery windows.
Underspend signals: If your ad set consistently underspends (spending less than 80% of its daily budget), it's typically one of: audience too small, bid too low, creative quality score too low, or ad set in a restricted learning phase. An underspending ad set is not a pacing problem — it's a delivery or targeting problem.
<Callout type="warning"> Don't increase a Meta ad set budget dramatically to compensate for underspend. Tripling a budget on a poorly-performing ad set won't fix delivery — it will just burn budget faster on an ad that isn't working. Diagnose the underspend cause first. </Callout>
The weekly budget review: a practical checklist
Pacing is a weekly discipline, not a monthly one. Once a week (Monday morning recommended, before the week's campaigns are in full swing), pull the following:
1. Channel-level pacing check - Spend MTD per channel - Days elapsed in month - Implied full-month spend at current daily rate - Variance from monthly target (+ or −%)
2. Campaign-level exceptions - Any campaign spending >20% above or below its weekly target - Any campaign with 0 conversions in the past 7 days (potential tracking issue) - Any campaign in "Limited by budget" status
3. Learning phase inventory - Google: any campaigns that entered Smart Bidding learning phase in the past 7 days (avoid budget changes during learning) - Meta: any ad sets in "Learning" or "Learning limited" status
4. Reallocation opportunities - Channels tracking to underspend by >15%: is there a higher-marginal-ROAS channel that could absorb the surplus? - Channels tracking to overspend by >15%: reduce daily budget or add campaign-level budget caps
Reallocating mid-flight without disrupting learning phases
The most operationally dangerous thing you can do to an automated bidding campaign is make large, sudden budget changes. Both Google Smart Bidding and Meta's delivery algorithm use recent spend history to calibrate their bid predictions. Disrupt the pattern sharply and you can trigger a fresh learning phase, costing you 5–7 days of reduced performance.
The safe reallocation threshold:
For Google Smart Bidding campaigns: - Changes under 10–15% of current daily budget are generally safe — the algorithm treats these as minor adjustments - Changes above 20% may trigger a learning phase re-entry - If you must make a large change, use a scheduled increase over 3–5 days (e.g., +10% per day) rather than one large jump
For Meta campaigns in active delivery: - Budget increases of more than 20% can reset an ad set's learning phase - The official Meta guidance is to keep budget changes under 20% every 7 days when a campaign is performing well - Decreases are generally safer than increases in terms of learning disruption, but can cause under-delivery if cut too aggressively
When a learning phase reset is acceptable:
If an existing campaign is already underperforming — CPA 30%+ above target, or ROAS 25%+ below floor — a learning phase reset is not a significant additional cost. The campaign isn't optimising well anyway. In this case, you can make the large budget change (or bid change) and accept the reset. You have less to lose.
If a campaign is performing at or above target, protect the learning phase at all costs. Make incremental changes only.
Shared budgets and flight scheduling as pacing levers
Beyond direct budget edits, two Google Ads features give you more surgical control over pacing:
Shared budgets: A shared budget pools a daily spend target across multiple campaigns. If Campaign A is limited by budget on a high-intent day and Campaign B is underspending, a shared budget lets Google reallocate dynamically. Use shared budgets for campaigns that serve the same goal (e.g., all non-branded search campaigns) and where you're comfortable with Google making intra-day allocation decisions.
Avoid shared budgets across campaigns with very different ROAS targets or conversion goals — Google will favour the campaign generating the most conversion signal, which may not align with your portfolio strategy.
Campaign end dates and flight scheduling: Setting explicit start and end dates on Google campaigns is useful for: - Promotional flights (sale periods, seasonal campaigns) where you want automatic shutoff - Budget exhaustion management: a campaign with a lifetime budget and an end date will automatically adjust its daily pace to hit the budget by the end date - Avoiding the problem of a campaign that's technically "done" (post-event) still accruing minor spend
For always-on brand campaigns, avoid end dates — unexpected campaign shutoffs are a common source of traffic gaps.
Hands-on exercise
Build a budget pacing tracker.
Create a spreadsheet with the following structure for a hypothetical 3-channel account (Google Search, Meta Prospecting, Meta Retargeting) with a combined monthly budget of ₹40L:
Columns (one row per channel):
| Column | Description |
|---|---|
| Channel | e.g., Google Search — Non-Brand |
| Monthly Budget (₹) | Target spend for the month |
| Days Elapsed | Current calendar day |
| Days Remaining | 30 − days elapsed |
| Spend MTD (₹) | Actual spend so far |
| Budget Remaining (₹) | Monthly Budget − Spend MTD |
| Required Daily Rate (₹) | Budget Remaining ÷ Days Remaining |
| Actual Daily Rate (₹) | Spend MTD ÷ Days Elapsed |
| Pacing Variance (%) | (Actual − Required) ÷ Required × 100 |
| Alert Flag | "⚠️ Overpace" / "⚠️ Underpace" / "✅ On track" |
Alert logic (use IF formulas): - Pacing variance > +15%: "⚠️ Overpace" - Pacing variance < −15%: "⚠️ Underpace" - Otherwise: "✅ On track"
Populate with sample data for day 12 of a 30-day month: - Google Search Non-Brand: ₹18L budget, ₹7.2L spent - Meta Prospecting: ₹14L budget, ₹4.9L spent - Meta Retargeting: ₹8L budget, ₹3.8L spent
Success criteria: - All formulas calculate correctly from a single "days elapsed" input cell - Alert flags trigger correctly for each channel based on their variance - You can identify which channel needs immediate attention - You've written a one-sentence action recommendation for the channel flagged as overpacing
What's next
Chapter 3 builds on the allocation and pacing framework with the third lever: bid strategy. Knowing where to spend money (Chapter 1) and how to pace it (Chapter 2) is only useful if the platform's bidding algorithm is calibrated correctly — and that calibration is the subject of automated bid strategies.
[1]: Google Ads Help, "About daily budgets", https://support.google.com/google-ads/answer/2471188 [2]: Google Ads Help, "Shared budgets", https://support.google.com/google-ads/answer/7065882 [3]: Meta Business Help, "Campaign budget optimisation", https://www.facebook.com/business/help/214319818801882
References
Automated Bidding Strategies — tCPA, tROAS, Max Conversions, and When to Go Manual
Budget allocation tells you how much to spend on each channel. Bid strategy tells the platform's algorithm how to spend it. Get the bid strategy wrong and even a perfectly allocated budget will underperform — either by chasing efficiency at the cost of volume, or by chasing volume at the cost of margin.
This chapter gives you a decision framework for every bid strategy available on Google Ads and Meta, with a clear view of when each one is correct and when it will hurt you.
Prerequisites check
Before starting, confirm you can:
- Navigate to campaign-level bidding settings in Google Ads (Campaign → Settings → Bidding)
- Find conversion tracking setup in your Google Ads account (Tools → Measurement → Conversions)
- Check your conversion volume for the past 30 days at the campaign level
If you don't have at least 20–30 conversions per month on a campaign, this chapter will still give you the vocabulary and framework — but Smart Bidding won't be a viable option until you build that conversion history.
The automated bidding decision tree
Every bid strategy decision starts with three questions:
- What is this campaign optimising for? Conversions (leads, purchases), conversion value (revenue), or clicks/awareness?
- Do I have a performance target? A target CPA or target ROAS I need to hit?
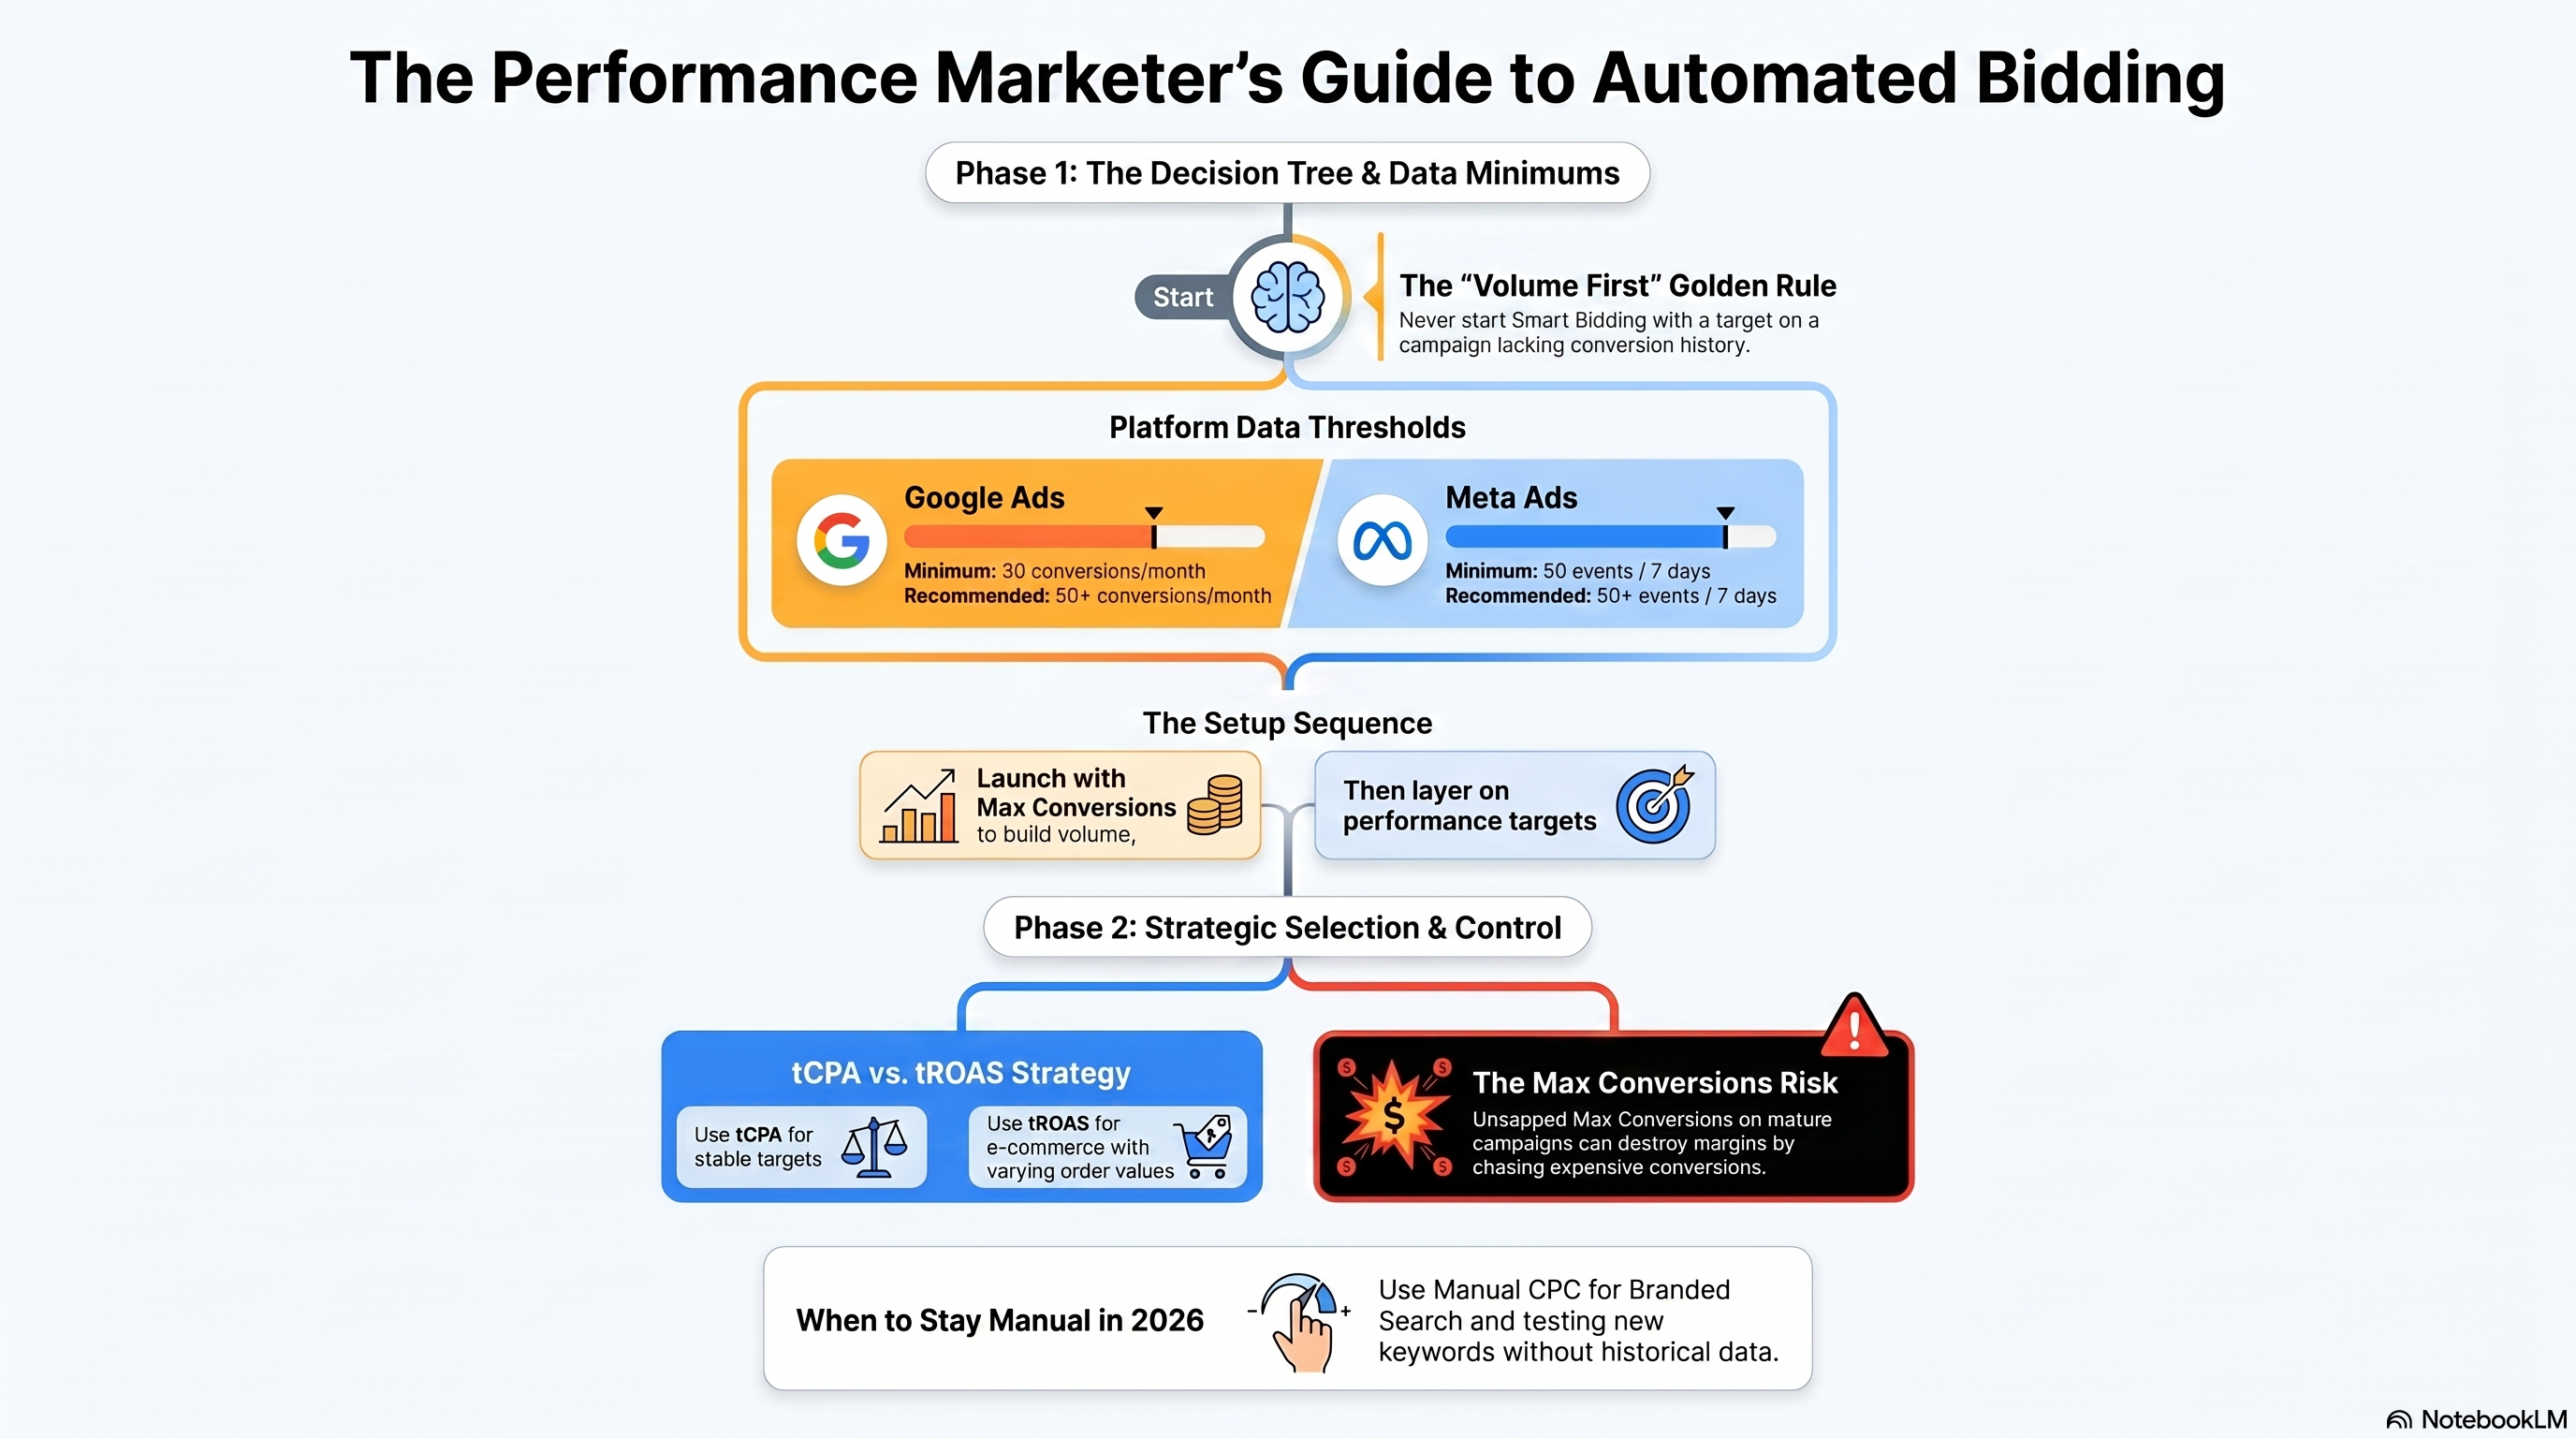
- Do I have enough conversion data? At least 30 conversions/month for Google, 50 conversions/7 days per ad set for Meta?
Here is the decision tree:
Optimising for conversions or revenue?
│
├── YES — do you have a specific efficiency target (CPA or ROAS)?
│    │
│    ├── YES — enough historical data (≥30 conversions/month)?
│    │    ├── YES, have ROAS target → tROAS
│    │    └── YES, have CPA target → tCPA
│    │
│    └── NO (not enough data yet)
│         └── Max Conversions (build volume, then set targets)
│
└── NO — awareness / clicks campaign
     └── Manual CPC, Manual CPM, or Target Impression Share
The core principle: never start Smart Bidding with a target on a campaign that doesn't have conversion history. The algorithm has nothing to learn from. You'll either over-restrict bids (missing volume) or under-restrict bids (spending without a signal). Build conversion volume first, then layer on targets.
Target CPA (tCPA): efficiency-first automation
What it does: Google or Meta aims to get you the maximum number of conversions at or below your target cost-per-acquisition. The algorithm adjusts bids in real time for every auction, using signals like device, time of day, audience, keyword match quality, and conversion probability.
When to use it: - You have a clear, stable CPA target derived from unit economics (e.g., customer acquisition cost cannot exceed ₹500 to be profitable) - The campaign has ≥30 conversions/month (Google's recommended minimum; 50+ is more reliable) - Your conversion events are consistent — same action, same funnel stage, no seasonal spikes in conversion rate that the algorithm hasn't seen before
How to set the target: Don't guess. Calculate it from your actual conversion history.
Starting tCPA = (Total spend in last 30 days) ÷ (Total conversions in last 30 days)
If your campaign averaged ₹420 CPA over the past 30 days, start your tCPA at ₹420. Don't set an aspirational target (e.g., ₹300) on day one — the algorithm will over-restrict bids to hit an unfamiliar target and volume will drop sharply. Tighten the target by 5–10% every 2 weeks once the algorithm proves it can hit the initial target.
The volume vs. efficiency trade-off: The lower your tCPA target, the more the algorithm restricts bids. At some point, the target is so tight that the algorithm can only enter a small fraction of auctions — volume collapses. This is the efficiency frontier of tCPA: you can get very low CPAs, but at negligible volume. The right target is the one that produces acceptable CPA at the volume your business needs.
<Callout type="warning"> Don't evaluate a tCPA campaign for the first 2 weeks. Google's Smart Bidding needs a learning period (typically 1–2 weeks or ~30–50 conversions) to calibrate. Performance during this window will be inconsistent. Judging the strategy by week-1 data and switching off is one of the most common mistakes in automated bidding. </Callout>
Target ROAS (tROAS): revenue-first automation
What it does: The algorithm maximises revenue (conversion value) while maintaining your target return on ad spend. Instead of optimising toward a binary conversion event, it optimises toward transaction value — which requires that your conversion tracking sends revenue data back to the platform.
When to use it:
- You sell products or services with varying order values (e-commerce, OTAs, subscription upgrades)
- Your conversion tracking passes transaction revenue via Google's conversion_value parameter or Meta's purchase event value
- The campaign generates ≥30 conversions/month (Google recommendation), ideally with good value diversity (not all conversions at the same fixed price)
Setting the tROAS target: The same principle as tCPA applies — start at your historical average.
Starting tROAS = (Total conversion value in last 30 days) ÷ (Total spend in last 30 days)
If the campaign produced ₹30L revenue on ₹9L spend last month, your historical ROAS is 3.33x. Start tROAS at 3.0x to give the algorithm headroom, then tighten toward 3.5x over subsequent months.
When tROAS fails: tROAS requires accurate revenue signals. If your conversion tracking has gaps — some purchases not tracked, value sent as a fixed ₹1 placeholder, or value in the wrong currency — the algorithm is optimising against garbage data. Audit your conversion value tracking before enabling tROAS. A campaign running on broken value signals will produce wildly inconsistent performance.
Max Conversions and Max Conversion Value: uncapped volume modes
Max Conversions tells Google: spend the available budget and get as many conversions as possible, with no CPA target. The algorithm has maximum bid flexibility — it will enter any auction it believes can produce a conversion, regardless of cost.
Max Conversion Value is the revenue-equivalent: spend the budget, maximise total revenue, no ROAS floor.
When Max Conversions is right: 1. New campaign launch: You need conversion volume before you can set a tCPA target. Run Max Conversions until you have ≥30 conversions, then switch to tCPA. 2. Seasonal surge with high ROI tolerance: During peak periods (Diwali, Big Billion Days) when demand is high and you've set a higher budget specifically to capture incremental volume, Max Conversions lets the algorithm swing freely. 3. Testing new campaign types: When launching a new Shopping campaign structure or a new Performance Max campaign where you don't yet know the expected CPA range.
When Max Conversions destroys margin: 1. Uncapped on a mature, always-on campaign: A campaign that's been running for 6+ months with consistent CPA should have targets set. Removing targets lets the algorithm chase marginal conversions at 5–10x your target CPA to hit volume. Margin disappears. 2. Low-quality conversion events: If your "conversion" is a page view, email sign-up, or any low-intent event, Max Conversions will spend your entire budget on the cheapest form of that event — which may have zero downstream revenue value.
Meta's bidding options: cost caps, bid caps, and target costs
Meta's terminology is different from Google's but the logic is similar.
| Meta Strategy | Google Equivalent | What It Does |
|---|---|---|
| Lowest Cost (no cap) | Max Conversions | Spend the budget, get as many results as possible |
| Cost Cap | Target CPA | Aim to keep average cost per result at or below your cap |
| Bid Cap | Manual CPC upper limit | Set a hard ceiling on how much Meta bids per auction |
| Minimum ROAS | Target ROAS | Only enter auctions where Meta expects your return will meet the minimum |
Cost Cap is Meta's primary efficiency control. It works similarly to tCPA — you set a target, Meta adjusts bids to stay at or below it. The same rule applies: start at your historical average CPR (cost per result), not an aspirational target.
Bid Cap gives you direct control over auction bids. It's the most aggressive efficiency lever but also the most volume-restrictive. Use it only when you're in a highly competitive auction and want to prevent overpaying for a specific placement — not as a default setting.
Data minimums: when Smart Bidding cannot work
Google's Smart Bidding and Meta's algorithmic delivery both require sufficient conversion data to function reliably. Operating below these minimums with targeted bidding produces erratic performance.
Google Ads: - Minimum to enable tCPA/tROAS: 30 conversions/month in the past 30 days (at the campaign level) - Recommended for reliable performance: 50+ conversions/month - Portfolio bid strategy (cross-campaign pooling): Can aggregate conversions from multiple campaigns, useful when individual campaigns are below threshold
Meta: - Learning phase threshold: 50 optimisation events per ad set per week (e.g., 50 purchases per ad set per 7-day window) - Below threshold: Ad set enters "Learning Limited" — delivery is more variable and CPRs are typically higher - Remedy for low-volume ad sets: Broaden audiences, consolidate ad sets, or switch the optimisation event to a higher-funnel action (e.g., optimise for Add to Cart instead of Purchase if purchases are too few)
When manual bidding still wins in 2026
Despite the quality and sophistication of automated bidding in 2026, manual CPC and manual CPM are still the right call in two common situations:
Situation 1: Branded search with high intent and low competition.
Branded search (queries containing your company or product name) typically has low CPCs, high conversion rates, and minimal competition. Smart Bidding adds complexity to a simple, high-performing campaign and may artificially inflate bids to "protect" conversions that would happen anyway. Many mature advertisers keep branded search on manual CPC with well-calibrated bid adjustments and see equivalent or better performance with better cost control.
Situation 2: New keyword or creative testing.
When testing a new keyword group or ad copy variant where you have no historical data, Smart Bidding has no signal. It will bid randomly, inflating the apparent test costs. Run the test on manual CPC to control your bid level, gather initial data, then graduate to automated bidding.
Hands-on exercise
Audit a campaign structure and assign bid strategies.
You're managing the following campaigns for a B2C travel booking platform (EaseMyTrip-type business):
| Campaign | Monthly Conversions | Avg CPA | Conversion Type | Notes |
|---|---|---|---|---|
| Google Branded Search | 220 | ₹180 | Booking confirmed | High impression share (96%) |
| Google Non-Brand — Flights | 85 | ₹420 | Booking confirmed | Impression share: 48% |
| Google Non-Brand — Hotels | 28 | ₹610 | Booking confirmed | New campaign, 3 months old |
| Google Display Retargeting | 42 | ₹290 | Booking confirmed | Audience: site visitors 30d |
| Meta Prospecting — Travel Intent | 18/week per ad set | ₹380 | App Install | 3 active ad sets |
| Bing Brand Search | 35 | ₹210 | Booking confirmed |
Your task:
For each campaign, answer: 1. Which bid strategy should it be on today (given current data volumes)? 2. If it should change bid strategy in the future, what trigger would cause that change? 3. One specific operational risk to watch for with your recommended strategy
Success criteria: - Each campaign has a clearly reasoned strategy recommendation - Any campaign below data minimums is identified and given a volume-building path - You've named the specific risk for at least 3 campaigns (e.g., "Learning phase reset risk if budget is changed >20%") - Branded search is treated as a separate strategic case from non-brand
What's next
Chapter 4 addresses the hardest problem in multi-channel management: figuring out what's actually working. With multiple channels each claiming credit for the same conversions, and platform attribution models designed to favor their own inventory, you need a framework for seeing through the noise and making budget decisions based on incremental truth.
[1]: Google Ads Help, "About Smart Bidding", https://support.google.com/google-ads/answer/7065882 [2]: Google Ads Help, "Target CPA bidding", https://support.google.com/google-ads/answer/2979071 [3]: Meta Business Help, "Bid strategy guide", https://www.facebook.com/business/help/2219484658172892
References
Cross-Channel Attribution, ROI Forecasting, and Making the Budget Case
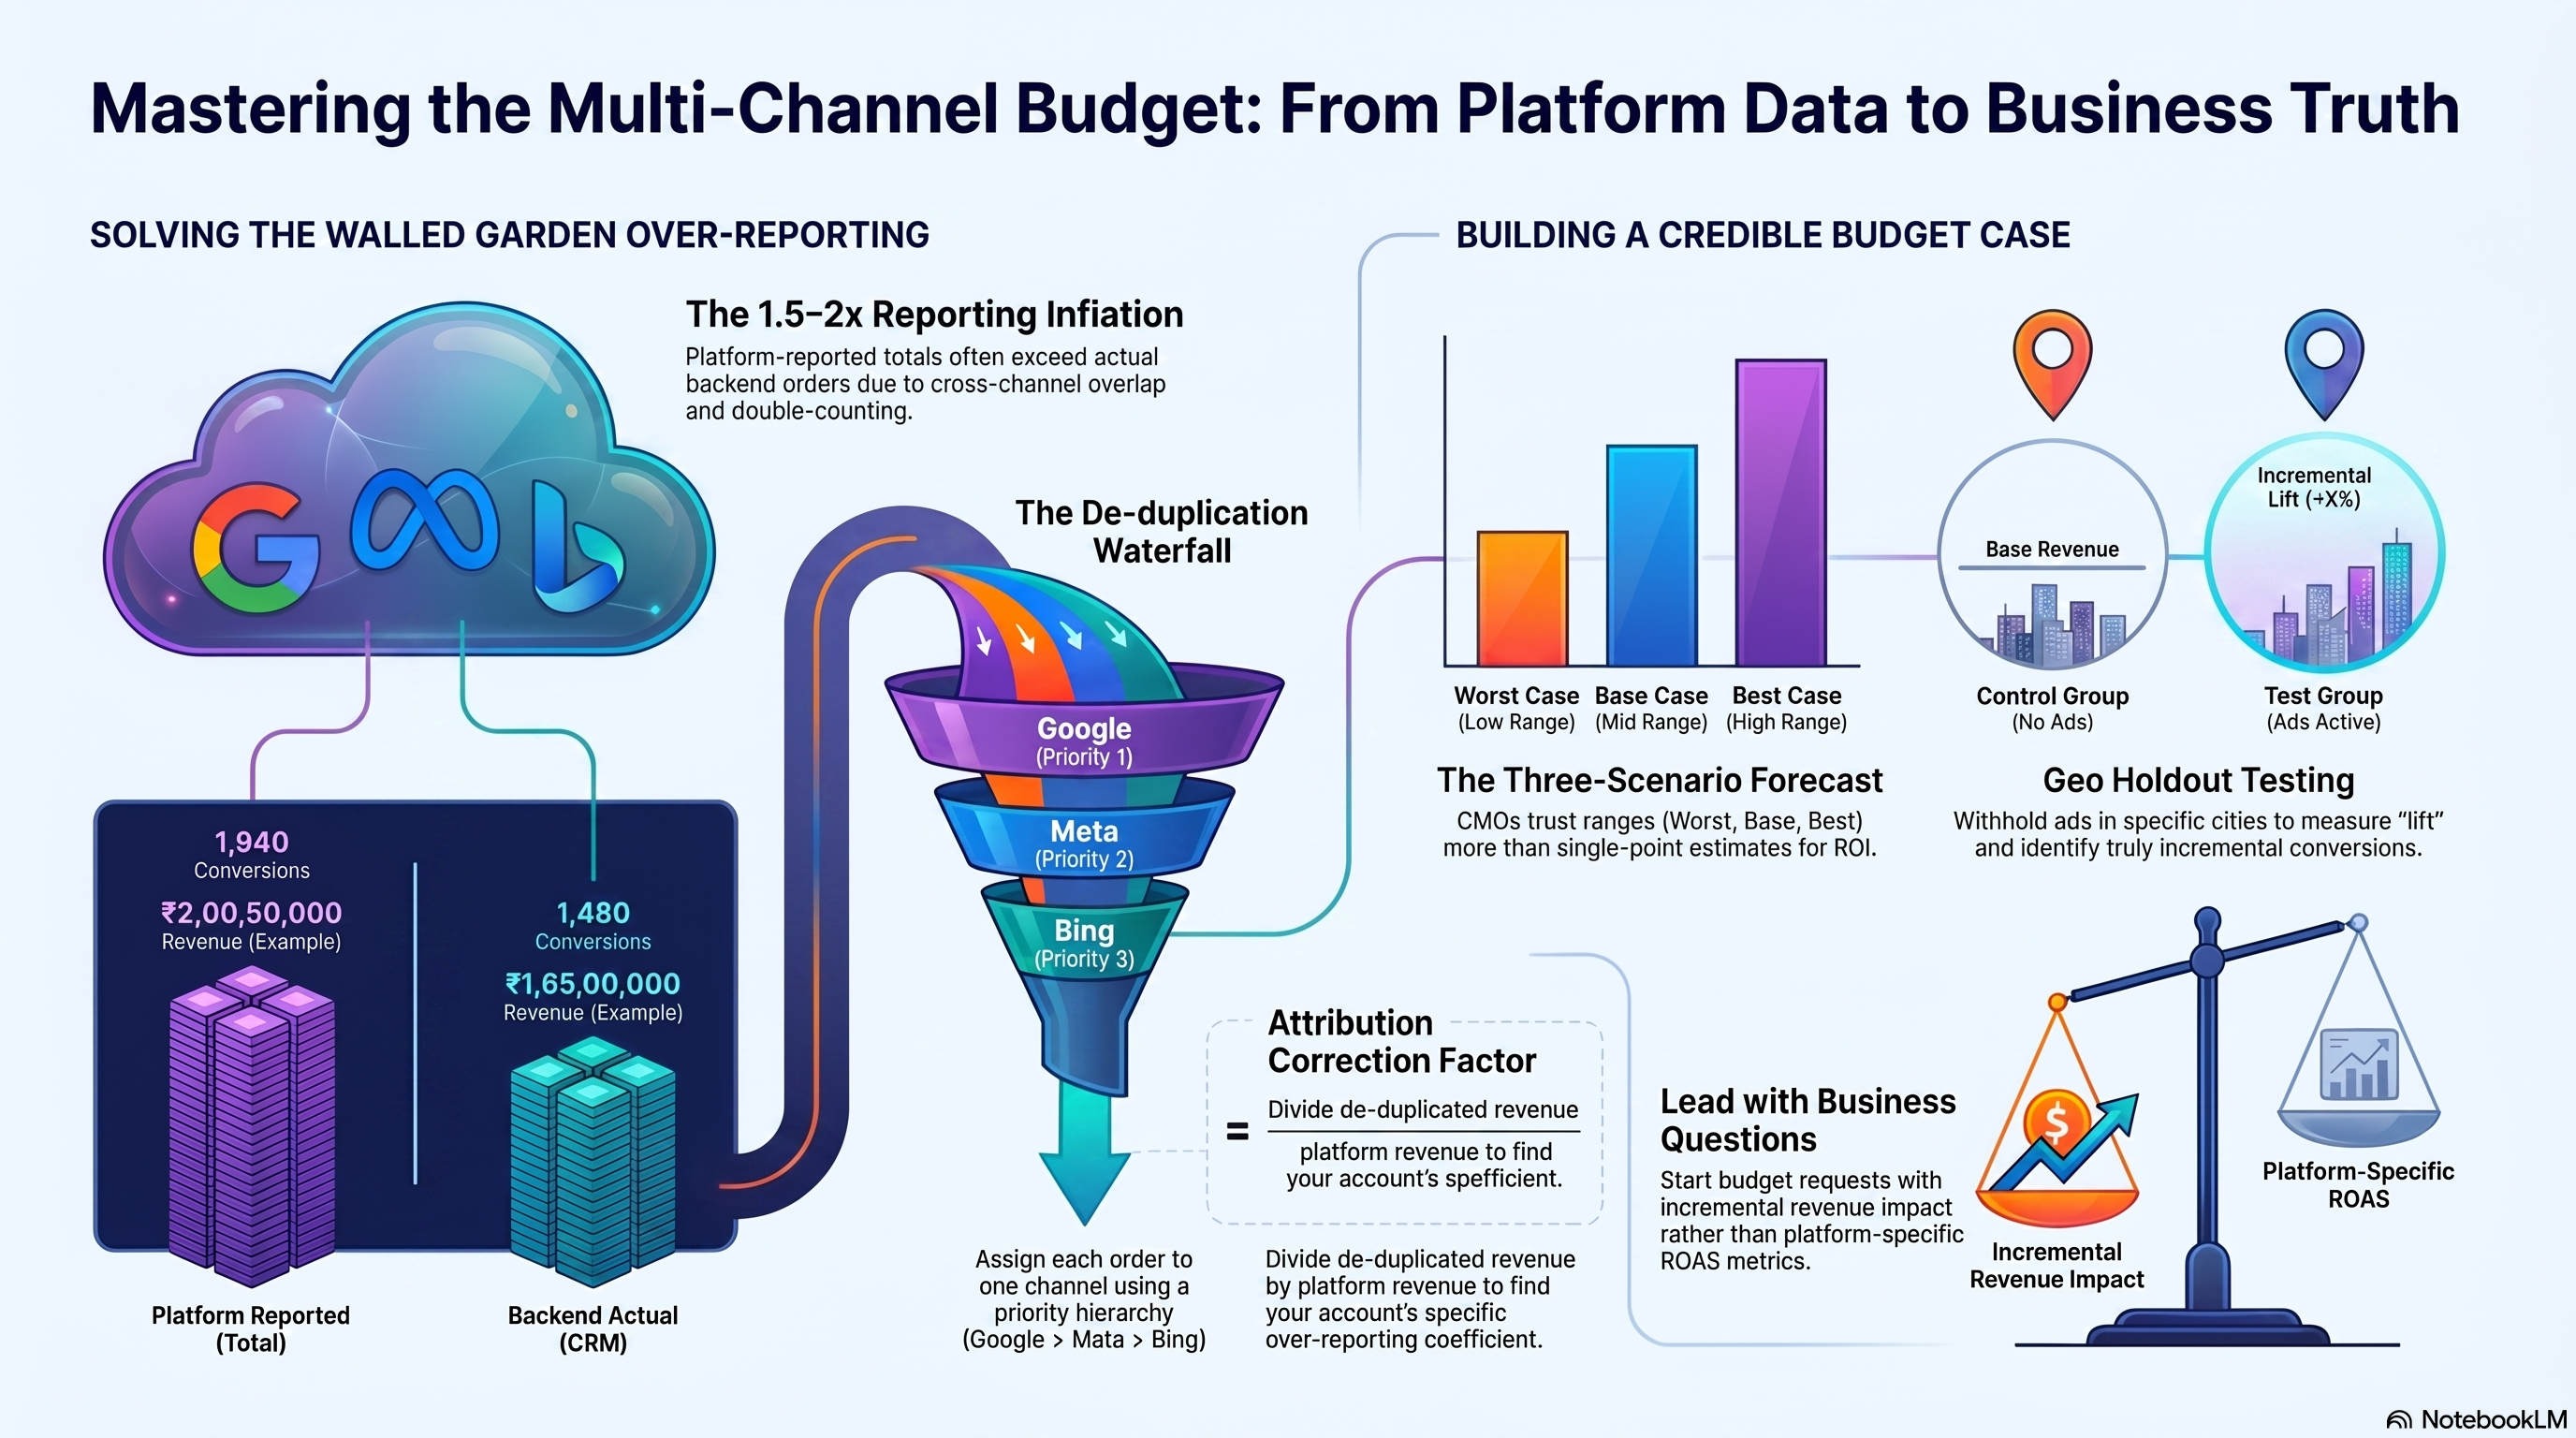
Every channel claims credit for your conversions. Google's data-driven attribution model assigns credit to Google touchpoints. Meta's delivery algorithm attributes purchases to Meta impressions and clicks. Bing does the same. At ₹50L/month of combined spend across three channels, your platform-reported total conversions can easily add up to 1.5–2x your actual conversion count.
This is the walled garden problem: each platform is a credible narrator of its own version of the truth. None of them shows you the whole story.
This chapter gives you a practical framework for building a de-duplicated view of cross-channel performance, forecasting ROI in a way that doesn't mislead stakeholders, and using incrementality tests to establish the ground truth your attribution models can't provide.
Prerequisites check
Before starting, confirm you can:
- Export a conversion report from Google Ads segmented by date and campaign
- Export a conversion report from Meta Ads Manager segmented by date and ad set
- Pull your backend CRM/revenue data for the same date range (even a simple CSV of purchase date + revenue works)
If your platform data and backend data have never been reconciled, this chapter will show you how and why to do it. The exercise at the end requires at least one week of data from two channels plus backend order data.
The four attribution models
An attribution model decides how to distribute credit for a conversion across the touchpoints in the customer journey.
Last-click attribution: 100% of credit goes to the last channel the customer touched before converting. Simple and auditable. Problem: it systematically over-credits bottom-funnel channels (branded search, retargeting) and gives zero credit to awareness channels that initiated the purchase intent.
First-click attribution: 100% of credit goes to the first touchpoint. The opposite bias: it over-credits awareness campaigns and ignores the channels that closed the sale.
Linear attribution: Credit is distributed equally across all touchpoints in the journey. A customer touched by Meta ad → Google non-brand → Google brand → purchase would give each channel one-third of the credit. Less extreme than first- or last-click, but still arbitrary — assumes all touchpoints contribute equally.
Data-driven attribution (DDA): A machine learning model trained on actual conversion paths in your account, assigning credit based on observed lift from each touchpoint. Google and Meta both offer platform-specific DDA models.
DDA sounds like the obvious winner, but it has a critical limitation: it is trained only on data the platform can observe. Google's DDA sees Google touchpoints; Meta's DDA sees Meta touchpoints. Neither model sees the full customer journey. Both models are biased toward their own inventory.
The walled garden problem: why reported conversions don't add up
Here's the scenario that every large-scale performance marketer eventually discovers: you run Google Search and Meta Prospecting. Google reports 1,200 conversions last month. Meta reports 800 conversions. Your backend shows 1,100 actual orders. The math: 1,200 + 800 = 2,000 attributed conversions for 1,100 real orders.
Why does this happen?
Cross-channel overlap: The same customer was reached by both a Google ad and a Meta ad before converting. Both platforms count the conversion in their own reporting. There's no automatic deduplication at the platform level.
View-through attribution: Meta by default counts any conversion where the customer saw (but did not click) a Meta ad in the previous 1 day (1-day view default, though 7-day view is also available). If a customer was served a Meta ad in the morning and searched Google that afternoon to purchase, both platforms count the conversion.
Cross-device attribution: The customer saw a Meta ad on mobile but converted on desktop. Meta attributes the conversion via its cross-device matching (Facebook's first-party identity graph). Google also attributes via its signed-in user tracking. Double-count.
Platform-specific reporting windows: Google Ads defaults to a 30-day click attribution window and 1-day view-through window. Meta defaults to 7-day click + 1-day view. The windows don't align, creating further overlap.
Building a de-duplicated attribution view
You can't perfectly attribute every sale to a single channel without a full multi-touch attribution platform. But you can build a directionally accurate de-duplicated view with three steps.
Step 1: Anchor to backend order data.
Your CRM or order management system is the source of truth for conversion count. Pull: date, order ID, revenue, and any UTM parameters attached to the order (if your site properly passes UTM source, medium, and campaign to the backend on checkout).
Step 2: Apply a channel priority hierarchy.
Assign each order to the highest-priority channel that touched it, using a simple waterfall rule:
- If the order has a Google click within 30 days → attribute to Google (channel + campaign)
- Else if the order has a Meta click within 7 days → attribute to Meta
- Else if the order has a Bing click within 30 days → attribute to Bing
- Else → attribute to Direct / Organic
This is a simple ordered-priority model. It's not statistically perfect, but it eliminates double-counting, anchors to real order count, and gives you a single row per order.
Step 3: Compare the de-duplicated view to platform-reported metrics.
The ratio of (de-duplicated channel revenue) ÷ (platform-reported revenue) tells you your "attribution inflation factor" per channel. If Google is claiming ₹30L in revenue but the de-duplicated view gives it credit for ₹22L, the inflation factor is 1.36x — Google is over-reporting by 36% in your account. This factor becomes a correction coefficient for future platform-reported numbers.
<Callout type="warning"> The ordered-priority waterfall is not an industry standard — it reflects a deliberate choice to credit click-through above view-through and to prioritise Google over Meta (or vice versa, depending on your business). Document and communicate the rule clearly to stakeholders so they know what "attributed to Meta" means in your reports. </Callout>
The 30-day ROI forecast
Before requesting a budget increase or presenting a quarterly plan to a CMO, you need a credible ROI forecast. Here's a practical model structure.
Inputs (per channel):
| Input | Description |
|---|---|
| Planned monthly spend (₹) | The budget you're requesting or defending |
| Current avg CPA or avg CRev | Historical performance baseline |
| Expected conversion volume | Spend ÷ CPA |
| Expected revenue | Conversions × Avg order value (or use tROAS target) |
| Attribution correction factor | De-duplication adjustment (e.g., 0.85 if platform over-reports by 15%) |
| Adjusted revenue | Expected revenue × correction factor |
The sensitivity table:
A single-point forecast ("we'll generate ₹X in revenue") is fragile. Replace it with a three-scenario table:
| Scenario | Assumption | Revenue | ROAS |
|---|---|---|---|
| Worst case | CPA +20% above baseline | Lower | Below target |
| Base case | CPA at historical baseline | Expected | At target |
| Best case | CPA −15% below baseline | Higher | Above target |
What makes a forecast credible to a CMO:
- It's anchored to backend-reconciled historical data, not platform-reported numbers
- It shows a range, not a single point
- The key assumptions are explicit (e.g., "assumes iOS 18 does not change Meta's attribution window")
- It identifies the one or two variables that move the outcome most (usually: conversion rate and average order value, not CPM or CTR)
Incrementality testing: the only way to measure true impact
Attribution models, even good ones, don't answer the core business question: would these customers have converted anyway, without the ads?
This is the incrementality question. It matters enormously at large budgets. If 40% of your Google branded search conversions would have typed your domain directly (organic), then your true incremental ROAS on branded search is much lower than the 6–7x typically reported.
The most reliable way to measure incrementality is a geo holdout test: a controlled experiment where you withhold advertising from a randomly selected geographic region for a defined period, measure conversion rates in that region vs. a matched control group that continued seeing ads, and calculate the incremental lift.
How to set up a geo holdout test
Step 1: Select test and control geographies.
Choose 4–6 comparable cities or regions. Split them into two matched groups based on historical conversion rate, population size, and seasonality patterns. One group is the test group (ads turned off or significantly reduced). One group is the control (ads continue as normal).
For Indian B2C campaigns, a typical setup: Test cities = Pune, Ahmedabad, Chandigarh. Control cities = Mumbai, Bangalore, Delhi. These are approximate matches in terms of digital-native urban consumers.
Step 2: Define the test period.
Minimum 2 weeks. 4 weeks is better — long enough to smooth out day-of-week variation and observe the full conversion cycle (from ad exposure to confirmed booking for an OTA, for example). Avoid overlapping with known demand events (festivals, sales) that affect geos differently.
Step 3: Measure the lift ratio.
Incrementality Lift = (Conversion rate in control) − (Conversion rate in test) / (Conversion rate in control)
If the control group maintains a 2.4% conversion rate and the test group drops to 1.8% when ads are removed:
Lift = (2.4% − 1.8%) ÷ 2.4% = 25%
This means 25% of your conversions in this channel are incremental — they wouldn't have happened without the ads. The other 75% would have happened through organic search, direct, or other channels.
Using the lift result to justify a budget change:
If your branded search campaign reports 3,000 conversions/month at ₹1.2Cr and an incrementality test shows 25% lift:
- Incremental conversions: 3,000 × 25% = 750
- Incremental revenue (at ₹3,000 avg order): 750 × ₹3,000 = ₹22.5L
- True incremental ROAS: ₹22.5L ÷ ₹1.2Cr = 1.88x
This is far from the 6x the platform reports. It may or may not justify the spend depending on your profitability thresholds — but now you have an honest number to present.
Making the budget case to a CMO
Combining everything in this chapter, here is the structure for a persuasive budget case:
1. Start with the business question, not the ad metrics.
Wrong opening: "Our ROAS improved from 3.2x to 3.8x last month." Right opening: "We have evidence that ₹1L of additional Meta spend generates ₹3.5L of incremental revenue with 85% statistical confidence."
2. Present the de-duplicated baseline, not platform-reported.
Show the CMO your reconciliation methodology in a footnote. It demonstrates analytical credibility and pre-empts the "why don't our numbers add up" question.
3. Lead with the incrementality result if you have one.
Nothing cuts through attribution debate like a controlled experiment. "In our Q1 geo holdout test, Meta Prospecting showed 28% incremental lift, which is 12 points higher than we estimated from last-click attribution" is a decisive piece of evidence.
4. Use the three-scenario forecast.
Never present a single-point forecast. A range with explicit assumptions makes you look rigorous, not uncertain. "Base case: ₹18Cr incremental revenue on ₹5Cr spend. Worst case: ₹14Cr if conversion rates drop 15% from baseline."
5. Name the risk.
Every budget increase has a risk. Name it. "The main risk is that Meta's learning phase after the 30% budget increase takes 2 weeks, during which CPRs will be 15–20% above target. We recommend a 4-week hold period before evaluating the new baseline."
A CMO who approves a budget increase after seeing a rigorous, risk-acknowledged case is a partner. A CMO who approves based on inflated platform numbers will blame you when actuals miss.
Hands-on exercise
Build a de-duplicated attribution model and 30-day ROI forecast.
Dataset (provided as a scenario):
You're managing a B2C travel platform account with the following platform-reported data for the past 30 days:
| Channel | Platform Spend (₹) | Platform Conversions | Platform Revenue (₹) | ROAS |
|---|---|---|---|---|
| Google Branded | 12,00,000 | 800 | 80,00,000 | 6.7x |
| Google Non-Brand | 22,00,000 | 540 | 72,90,000 | 3.3x |
| Meta Prospecting | 10,00,000 | 320 | 22,40,000 | 2.2x |
| Meta Retargeting | 6,00,000 | 280 | 25,20,000 | 4.2x |
| Platform Total | 50,00,000 | 1,940 | 2,00,50,000 | 4.0x |
Your backend shows: 1,480 actual orders, ₹1,65,00,000 actual revenue.
Part 1 — De-duplication: 1. Calculate the platform total-to-backend reconciliation ratio (actual ÷ platform-reported) for both conversions and revenue 2. Apply that ratio as a correction factor to each channel's reported revenue 3. Calculate the de-duplicated ROAS for each channel
Part 2 — 30-day forecast: Propose a new 30-day budget allocation with a total of ₹55L (a ₹5L increase from current ₹50L). Use your de-duplicated ROAS to guide the allocation. Build a three-scenario table (worst/base/best) showing expected revenue and ROAS for your proposed allocation.
Part 3 — Stakeholder memo: Write a one-page budget recommendation memo (300–400 words) addressed to the VP Marketing. Your memo should: - Open with the business case (incremental revenue per rupee), not ad metrics - Reference the reconciliation gap and explain it briefly - Propose the ₹5L increase with allocation logic - State one risk and how you'd monitor it
Success criteria: - De-duplicated conversion and revenue totals match backend data - Proposed allocation uses marginal ROAS logic from Chapter 1 - Three-scenario forecast includes explicit assumption statements - Memo uses the word "incremental" at least once and avoids claiming platform-reported ROAS as the basis for the business case
What's next
This chapter completes the four-part framework. The capstone project asks you to apply all four lenses — allocation, pacing, bid strategy, and attribution — to a single account scenario: build a 90-day budget allocation brief for a ₹1Cr/month B2C performance marketing account.
[1]: Google Ads Help, "Attribution models", https://support.google.com/google-ads/answer/1722054 [2]: Meta Business Help, "About conversion attribution", https://www.facebook.com/business/help/1713977868859069 [3]: Microsoft Advertising, "About attribution", https://about.ads.microsoft.com/en-us/resources/training/courses